
Process Simulation
A few weeks ago we started to have a look at process analysis methods and discussed what a “base analysis” package for your organization could look like. In this article we will have a look at an advanced analysis technique – Process Simulation.
Simulation is typically used in the same phases of the solution lifecycle as the base analysis; either as part of the initial, high-level analysis to figure out if an identified process might have enough potential to be significantly improved, or (more likely) as part of the solution design phase, when the most optimal future-state process shall be determined.

In either way the objective is to implement a data driven analysis that will produce a predictable result before any changes to applications, organizations, processes, etc. will be implemented. This reduces risk for the future implementation – spending a lot of money and hoping that the assumptions that were made at the beginning of the process were correct, doesn’t seem to be a good and stable approach to me.
In addition to this, process simulation can also be used when creating a business case. The results in resource utilization (people or machines), or the improvement of throughput times/reduction of wait time (“waste” in Lean terms) can be used when creating a business case.
What is process simulation and why do I need it?
Simulation is a first step into a data-driven approach to process improvement. Instead and/or in addition to having workshop with SMEs you can use simulation to determine statistics that will build the foundation of your business case for a future change or implementation.
The typical benefits of using simulation are show in the graphic below:
- Improve the process by discovering bottlenecks, optimizing resource usage, and identifying patterns and best practices in your process
- Identify and analyze potential process risks and the impact the realization of these risks might have on your organization
- Assessment of potential benefits of planned transformations by determining the “most optimal processes”
- Analysis and prediction of activity-based process costs
- Establishment of enterprise-wide benchmarks.

This also brings up the question of where your Simulation tool should be located in the solution/process lifecycle and the supporting tools – especially since some (pure play) Process Mining vendors include a what/if functionality in their toolsets.
This is a bit misleading on their side, because the base piece of every process mining exercise is the underlying data set. This limits the possibilities of a proper simulation to the content of that data set. That means that you can change parameters of the what/if scenarios only for parameters of the underlying data set (what is not included cannot be simulated).
This is different to a proper simulation tool that is not confined to the limits of a data set. It will allow you to get more / different statistics (such as resource utilization of people and machines), but also allow you to add more detailed information to simulate, such as calendars and schedules. The results of a simulation can be exported to be further analyzed in statistics programs that 6-Sigma folks love to use.
Lastly, a proper Simulation tool allows you to throw out the initial process completely if your analysis points to this result, and you can start with simulation a new process that has been created on a fresh piece of virtual paper.
These reasons, and the fact that in a Process Mining tool you just can simulate one process (typically the sizing and cost for a process mining tool will be calculated on the number of processes and cases), while in a Simulation tool that is part of your design tool you can simulate as many processes as you want – Simulation is “just another” license/subscription.
What types of Simulation exist?
Simulation technology (that is not in your process mining tool) typically falls into two categories that aim for the same result:
- Discrete event simulation is an approach to create results by defining parameters for a simulation and then to run these as instances. This means you will define, for example, the frequency of the start event (e.g., 300 times/day) and the simulation engine will run 300 instances of the process for the time frame that is specified (e.g., “for 100 days”). This will then take other parameters into consideration and ensure that all potential walkthroughs are considered. Discrete event simulation is very precise and a “brute force” approach to simulation that works through a queue of instances.
- Monte Carlo simulation is a mathematical approach to simulation in which random samples and probabilities are calculated in an algorithm and deliver a result. Since this a bit less precise you will need a large enough calculated sample to approximate the simulation result.
Both methods are not mutually exclusive, and you can find Monte Carlo simulation in aspects of an otherwise discrete event simulation tool for certain aspects (factor variation, such as number of employees in an org unit) – this will speed up the simulation for these aspects because the simulation tool does not have to “hard run” the instances for this aspect
When you look at the typical simulation areas, you see three major categories:
- Process-related areas, including events, processes, cost, and rules in processes.
- Resource areas, such as human resources, technical or capacity resources (machines).
- Other areas that cover risks and controls, or the impact of variations in the calendar during the year or simulation period.
The graphic below shows the three areas and their typical areas of interest in an overview. Each of these bullets can be further detailed. One example is the processing time where you not only can define how long a process takes on average, but you can define the minimum and maximum time for each process and the simulation engine will take this into consideration and give you a “best case” and “worst case” result if desired.

What do I need for a simulation?
Theoretically, you can load any process model that includes events and tasks into a Simulation engine and run it. However, that might lead to a limited analysis result.
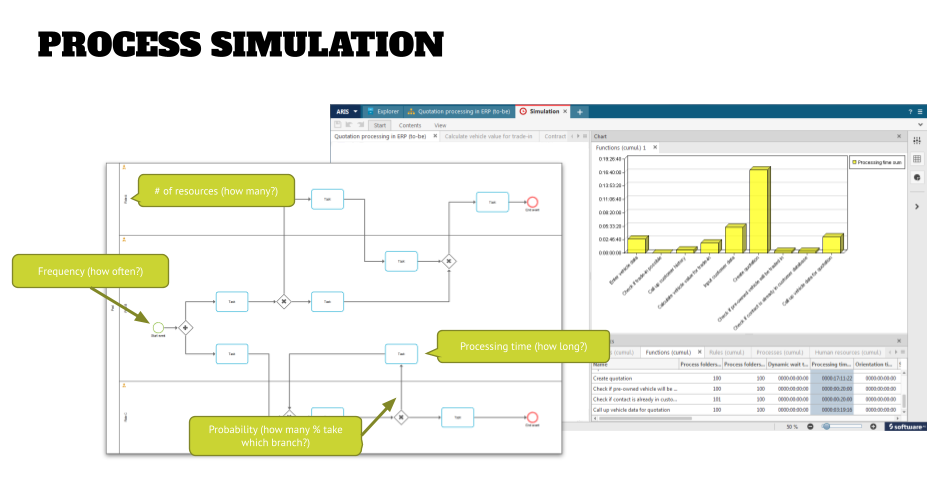
Therefore I recommend to start with four different types of information that will give you a good result that you can define with more details later:
- Frequency of the process execution. Does this process happen three times a day, 50 times an hour, or 6000 times a week? This information will be added to the start event and this determines the number of instances that a discrete event simulation will run.
- Processing time for each task. This can be an average time (recommended in the beginning) or minimum/maximum times for the task execution. Once you have gained experience, you might also want to add times for machine reconfiguration or static wait time – literally the time that paint needs to dry in a manufacturing process.
- Probability when branching – how many percent of the process instances go left or right when branching in the process flow. This information will be added as a percentage to the connections after the gateway.
- Number of (human) resources. This number can be added either for the org unit or the individual roles that are participants in the process, and will help determining bottle necks (everyone is busy in another instance) and the utilization of resources.
The graphic below shows these four bits of information on a process model.

When running a simulation in a tool, you can see an animation that indicates which step or resource is currently being analyzed. It typically also gives you statistics on how many times this individual object has been triggered.
However, the more interesting statistics will show up when you pause your simulation. Then the statistics will be collected and displayed in a tabular format up to the point where you are in your simulation. You can then select one or more columns in those tables that are of interest and generate charts from the selected data.
An example for this could be the selection of the processing time and the dynamic wait time (time that a process cannot be continued because you ran out of resources). The bar chart then will show two sets of bars and you can easily see not only where a bottleneck is (like the step “Create quotation” in the screenshot below).

The question now is what you will do with this initial simulation result. How do you change your process to get a better outcome? The typical things that I like to look at are:
- Can I resolve the bottleneck by just throwing more bodies at the task (changing the number of resources in the model) and see if solves the bottleneck or if there is another step now showing up as a new bottleneck.
This can be used to determine the best number of resources when you are planning your org changes in conjunction with a process improvement project. - Do I have conditions in the process that will limit resources – for example, if role 1 does step A, then role 1 must do step B. Can I let go of this condition, so that step B can be picked up by another free resource (after the paint has dried so to speak), so that role 1 can work on a new instance?
- Do I need to change the process, so that my machines (technical resources) can be used more optimally and do not sit idle?
- Or do I need to change the process completely and throw out the old process out of the window and start with a new process?
As you can see the answers to these questions will be done in iterations – you run a simulation and save the result. You change something and run the simulation again (BTW, turning off the animation speeds up the simulation significantly). Save the second result and compare it with the first. And so on, and so on.
After a few iterations you will get a feel of the type of changes that you do and which impact it has on the simulation results. Once you are at that point and find a “close enough” result to what you expect as an outcome, it is time to fine tune your simulation by adding more parameters that are mentioned below.
Conclusion
As you can see, Simulation is a good, fast, and cheap way to get an idea what the “best process” might look like before you start a project to design, implement, test, and roll-out your process improvement ideas.
In a few hours or days you will have identified the “most optimal process” that then can be used as the basis for developing a business case of an implementation project – just keep in mind that the “best process” can be something different for someone else than you … is it the fastest process execution, the one that uses the least resources, or the one that is the cheapest, for example? Having clarity about your assumptions and targets before you get started with simulation will give you results faster.
Depending on the Simulation tool that you use, you can also define Simulation Experiments, which are pre-configured simulations that you can roll-out to regular users who are not supposed to change the conditions of a simulation as described above. This will help you to create another process analysis “product” that you will provide to your organization (similar to the base analysis that we spoke about a few weeks ago).
Roland Woldt is a well-rounded executive with 25+ years of Business Transformation consulting and software development/system implementation experience, in addition to leadership positions within the German Armed Forces (11 years).
He has worked as Team Lead, Engagement/Program Manager, and Enterprise/Solution Architect for many projects. Within these projects, he was responsible for the full project life cycle, from shaping a solution and selling it, to setting up a methodological approach through design, implementation, and testing, up to the rollout of solutions.
In addition to this, Roland has managed consulting offerings during their lifecycle from the definition, delivery to update, and had revenue responsibility for them.
Roland has had many roles: VP of Global Consulting at iGrafx, Head of Software AG’s Global Process Mining CoE, Director in KPMG’s Advisory (running the EA offering for the US firm), and other leadership positions at Software AG/IDS Scheer and Accenture. Before that, he served as an active-duty and reserve officer in the German Armed Forces.