Base process analysis
This is the first of a few articles about process analysis, and covers the “base” analysis of a process without dedicated tools (besides your architecture tool), or additional data collection, for example, for simulation or process mining. Those “advanced” analysis methods will be covered in the future.
It does not aim to be a complete guide to process analysis and all the different angles one could dissect a process and find improvement opportunities, but it is meant to start the conversation about the need for “always improving” and how to do this. In addition to this, all the measures can be captured by hand, but a good architecture tool will have reports and other means available out-of-the-box, so that you can avoid painful counting.
Why process analysis?
In the past there were multiple waves of process improvement that aimed at different aspects, one approach (the Business Process Reengineering) aimed at rethinking the value-streams that are created by processes, while others (Lean/6 Sigma) approaches looked for smaller improvements in a given lower-level process.
In this article we are focusing on a single process or a combination of processes that are assembled in an End-to-End fashion. The two terms that are guiding the base analysis -or any process analysis for that matter- are:
- Value – the measurable business outcome of a process. This can be the ultimate outcome for a customer (“We solved a problem”, for example), or be a sub-outcome in a longer series of processes that ultimately will end in a customer outcome. An example of that could be the creation of a purchase order in a Procure-to-Pay process, which is needed to complete a first step of that process and trigger a vendor to send a product or perform a service.
- Waste – this includes all activities that do not contribute to value creation, but are performed “because we have always done it this way”. The Lean folks have a very tight definition of waste that I encourage you to have a look at. Examples for that are incomplete process execution, or a low quality of the outcome, which will require re-work that could have been avoided.
Please note that this does not mean that things like documentation of systems or things required by regulators should be eliminated from your processes, just because an end customer does not get an immediate benefit from it. Those activities are value-creating, but they serve other stakeholders than a paying end customer – a future IT team for example, that is tasked with updating a system, or the public that can be assured that things are done properly within the boundaries of the regulations in the two examples above.
When analyzing a process, you always should have those two aspects of process improvement in the back of your mind and evaluate the metrics below on those two things.
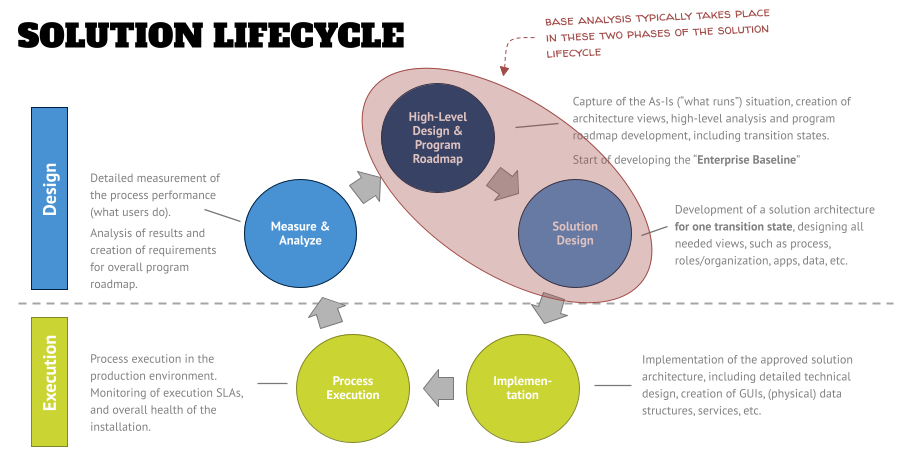
When looking at the solution lifecycle, that we’ve discussed in an earlier article, analysis can happen in the first two of the five phases – in the High-Level Design phase or the Solution Design phase. There is no hard rule on which type of analysis (higher or lower-level processes) shall be done in which phase. However, the examples below focus on a lower-level process analysis.
The examples below also don’t have the idea to be a complete set of metrics to capture and things to look at, but are meant to give you a head start in case you have never done this type of work before. I encourage you to spend some time in additional research on this topic (maybe also by reaching out to your tool vendor or consulting partner) and develop your own set of standard metrics you want to analyze your processes against.
The important point is that you get started and define a set of analysis that will be packaged as a product for all of your base process analysis. This will include tools, such as spreadsheet templates shown below, that might do calculations for you, or additional material that you will use to train new people in your toolset.

What are common analysis areas?
Since the number of things you could look at when analyzing your process, I recommend to focus on these five major areas as part of your “base process analysis” product:
- Process: Number of processes/tasks, org changes, tool changes, internal and external handovers, approvals and checkpoints, pain points, process gaps.
- Applications: Number of tools, tool redundancies, unique tool combinations, technical interfaces, workflows/integration.
- Organization: Number of org units/roles, consolidation of redundancies due to process improvements.
- Data: Project deliverables, messages on handovers, overlap in data/deliverables during the process.
- Risk and Controls: Number of identified risks and controls, percentage of risks mapped to control framework, degree of risk mitigation with identified controls.
As you can see, we are not restricting ourselves to the process view of your architecture, but also touch other architecture views that are relevant in the context of a process. This demonstrates again, that all views are related to each other and the distinction between process management and enterprise architecture are artificial, and you should avoid falling into the trap of only considering those aspects that are part of “your discipline”.
If you are interested in more on this topic, I recommend giving episode 2 of the podcast a listen.
Examples of metrics in the process view
But let’s get to the meat of this article – the example metrics of the analysis. The first area is the process view, and the main focus of the analysis is the effectiveness of processes. The following aspects should be in your focus:
Every handover – either internal to the process between roles, or external process interfaces to other parties (e.g., governance bodies) – creates a delay because the task ends up in a queue for a given role. The ideal state is to minimize the number of handovers, down to a state where one role completes a process from A-Z.
Switching tools from task to task not only creates an overhead effort in administering and maintaining the tools, but also requires the learning of different tools by the end user (different concepts, etc.). This, and the fact that every tool change causes a “mental switch”, delays the processing time of the task. The ideal state would be that a role can complete a process in one tool.
I addition to this, the manual entry of data from one tool into another (“swivel chair interface”) increases the danger of data inconsistencies, and errors. Ideally all data exchange will be automated to reduce this danger.
The number of tools per process is an indicator of how well the tool rationalization was done in a process area. This can be another indicator for the integration and maturity state of the process.
Multiple official checkpoints and approvals, scattered throughout the whole End-to-End process, create an overhead coordination and consolidation effort that should be minimized.
This is even worse, when the integration/submission is done via unstructured tools, such as email, or unstructured data formats, for example in presentations. In an ideal state these interactions are supported by workflow tools – which will also measure the workflow performance, and trigger notifications for end users in predefined cases, e.g., if a reply is due according to agreed service levels/response times, so that the overall delay on the process will be minimized.
These aspects can be measured, by either collecting the times or counting the number of occurrences. The graphic below shows two examples of counting measures.

Example metrics in the application view
The main objective of collecting data and rationalizing applications in the context of the process is the use of effective tools and the degree of their integration. You might want to have a look at the following areas:
The number of “real” enterprise tools, that are maintained on a controlled release cycle, versus “End User Computing” (EUC, such as user-created macros, for example) that might or might not follow the same principles and/or might not be recognized as an official tool with an asset number in the CMDB. This shows an indication of the level of standardization of the tool landscape.
Ideally all tools are known, registered, and rationalized – which includes a technology capability/functionality analysis to avoid functional redundancies.
Within an analysis, the number of tasks where a user has a “choice of tool” to use, shows the degree of standardization. In both cases the goal is to standardize – and going forward, to automate/integrate – tools as much as possible to improve data quality and minimize risks.
The number of technical interfaces, as well as the count of workflows (orchestration of multiple process steps via a workflow engine) show the degree of automation. The idea here is to bring this number up as high as possible, to avoid process inconsistencies (people don’t know what to do and find “creative ways” to get things accomplished increases risk), and also preserve/create data integrity within the overall tool landscape.
The analysis of the currently used technology for integration/automation/workflow might show a preference for a given technology, and is an indicator for a future technology decision (e.g., “buy a new central BPMS, or extend existing workflow capabilities?”).
Example metrics in the organization view
Even though organizations and roles are a crucial part of a process, looking at the organizational aspects separately will provide support metrics and can improve efficiencies that go beyond the (limited) scope of the process. For example, a rationalization and consolidation of roles can lead to reworking an enablement curriculum in the mid-term timeframe, which them will lead to simplifications and savings. Example metrics in the org view are:
Like in process handovers, the amount of different org units/roles within a process increases the potential of delays and waiting time in a process, due to the fact that some information will be stuck in someone’s inbox. The ideal state is to track this time and have service levels defined which will be tracked by a workflow engine or process mining automatically (that also sends out notifications if the SLAs are not met).
Another metric is the rationalization of org units and roles to find redundancies which might create confusion (“who is supposed to do what?”). The number of org units and roles –and the reduction of that number- will be an indicator of streamlining. Ideally, there is no redundancy in the responsibilities for certain process steps (e.g., reviews/approvals).
As a side note, during this exercise the sequence of role interactions can be rationalized – an example would be an approval process that requires five different roles to approve sequentially, while that approval could happen in parallel.
Example metrics in the data view
Looking at the invisible data structures and content targets the rationalization and reduction of information requests within the process, but also to improve the data quality of the organization as a whole. Example metrics can be:
Project deliverables are collections of data in a specific format (e.g., a document, model, or presentation) built for a specific purpose. However, more often than not, the same information is requested in a different format, and the rationalization and decomposition of data is needed to reduce work for re-creating the existing information.
In an ideal state, all data elements (“entities”) of a project are known and you can track when this information gets created, updated, shared, or retired. This also enables assigning responsibilities to certain entities and treating them as a “product” going through its own lifecycle.
Typically, data entities also build up on each other, and to improve a process one has to understand how the information is connected, so that the upstream/downstream sequence can be created correctly. In an ideal scenario, this data build-up/flow is shown for the whole project, and can be reused/classified for reuse in future projects.
Understanding the logical data structure also will help in defining the physical data structure in tool implementations and be the guideline for table creation / field naming while avoiding inconsistencies. The objective here is that changes in the physical data implementation are coordinated and guided by the business use of information (data rationalization).
Lastly, an enterprise-wide understanding of the data that is created/used will reduce the number of redundant, disconnected implementations by providing a baseline of “how things are tied together”.
Example metrics in the risk and control view
The last area of the base process analysis looks at (regulatory) compliance. The metrics captured here will give an input on the degree of compliance of the process. Example metrics are:
The number of risks and the controls that are associated with processes and process steps will give a metric of “coverage” (“Have we thought of everything? Are all risks mitigated by controls?”). Obviously, you don’t want to have non-mitigated risks in your process.
In addition to this, the comparison with a GRC framework (for example, COBIT) will produce information to which degree the risks in the framework occur in the process, what you have might missed, and how well the identified risks cover those.
Another metric shows the relationship between controls and risks. Do we have a 1:1 relationship or can, for example, a control mitigate multiple risks while still being effective and manageable. Adding a process context can help with rationalizing the risk and control frameworks in the organization.
How do I capture the data and what do I do with it?
All the different data points shall be collected in a central place, where you can then can do additional calculations or filter the results by various dimensions, such as org units (to see if the process is a problem just in one area of your organization or a general problem). This will determine your recommendations later.
As a minimum, a spreadsheet can be your initial repository for your data collection – as shown in the project example below. Or maybe your architecture tool provides a means to store this information and display them in a dashboard format. Or you might decide to build a separate database for collecting the data – in the end, what matters is that you have a structure defined that will support a systematic storage of results, and allows you to do further analysis.

If in your version 1 of the “base process analysis” package a worksheet is the repository, you should not stop getting this rolled out. Do not try to build “the better mouse trap” (for example a relational database), but save this for a future version of your toolkit.
However, it is not enough to just capture data. You need to create information from it (“what does that mean?”) and then generate insights (“what do I do now to improve this situation?”). To create insights from the data in your repository, you want to:
- Look for patterns. Take a step back once you have collected the data and check the calculated values. For example, is there a governance unit that always requires a large effort of preparing data and rework compared to others? Or is there a point in the process that stops progress because some contributions by others are consistently not available on-time?
- Develop hypothesis and validate them with the data. Once you have a feel for the issues of the process, you might want to develop your hypothesis; for example: “Is the reason for the delay in receiving goods from our vendors a problem with a specific vendor or a specific type of material that is ordered? Are our warehouses built in a way that they don’t support the delivery of large goods?”
- Develop and map KPIs to the areas. For example, one finding might be that you have a ton of data that will be “delivered on a silver platter” to governance bodies during the process. What is your target KPI for this? Zero and implementing a “pull” approach? Or is the preparation for a major stakeholder group, such as management or the ARB, acceptable? And if so, what defines a group that receives that special treatment and which ones don’t?
- Relate this to pain points that you capture during your interviews (either while you create the process models, or as part of your analysis). The humans doing these processes for years or even decades know the ins-and-outs like nobody else. But be aware that humans also want to solve problems and might tell you what needs to change (“We just need to replace system XYZ”) – this can be true, but I would note the suggestions down and check if they fit into your analysis results later.
As you can see, it is the transformation from raw data to information into insights that is the objective of this phase.
Then you need to communicate your results. When you develop an analysis readout presentation, avoid the trap of getting hung up on the amount of work that you’ve done, but frame your results in the context of the insights. You might want to use the five areas above as a conceptual framework on a slide if you want to bring an architectural flavor to your presentation and also educate your audience a bit on this topic.
Then develop action items for each of these insights that can be measured in the next phase of your project. Your initial readout becomes the baseline for future measurement.
Roland Woldt is a well-rounded executive with 25+ years of Business Transformation consulting and software development/system implementation experience, in addition to leadership positions within the German Armed Forces (11 years).
He has worked as Team Lead, Engagement/Program Manager, and Enterprise/Solution Architect for many projects. Within these projects, he was responsible for the full project life cycle, from shaping a solution and selling it, to setting up a methodological approach through design, implementation, and testing, up to the rollout of solutions.
In addition to this, Roland has managed consulting offerings during their lifecycle from the definition, delivery to update, and had revenue responsibility for them.
Roland is the VP of Global Consulting at iGrafx, and has worked as the Head of Software AG’s Global Process Mining CoE, as Director in KPMG’s Advisory, and had other leadership positions at Software AG/IDS Scheer and Accenture. Before that, he served as an active-duty and reserve officer in the German Armed Forces.