How to model data (pt. 4) – how is data used?
In the previous articles of this series we have answered the questions “what is my data?” and “where do I store my data?”. We also had a look at where logical data is used.
This final article about data modeling now has a second look at the where data is used and answers the question “where do I ask for data”. This closes the loop and will cover 95% of all data modeling questions an architect might come along when creating blueprints.
Data lives in the context of processes
Besides using data in application models as shown in the last article, typically you see data being a part of processes. It can be shown as inputs and outputs mapped to process steps. In BPMN for example these will be shown as “document” symbols, but typically these are clusters and can be treated as described earlier.

Another way to model data is to add the clusters directly to an assigned model to the process step. This has the benefit that the main focus of the process -showing the control flow- is not cluttered by other objects.
Modeling it this way, which by some tools is implemented by default when creating relationships using the properties dialog, has the benefit that you can be more specific in your modeling by using object types that are not included in the process notation (for BPMN that would be applications, risks, controls, etc. for example). You can also use different connections to model RACI connections of roles to tasks, while avoiding a complicated modeling of the process, because a swimlane only has the semantics of “carries out” but does not allow to model a second connection, such as “contributes to”.
Data in screen diagrams
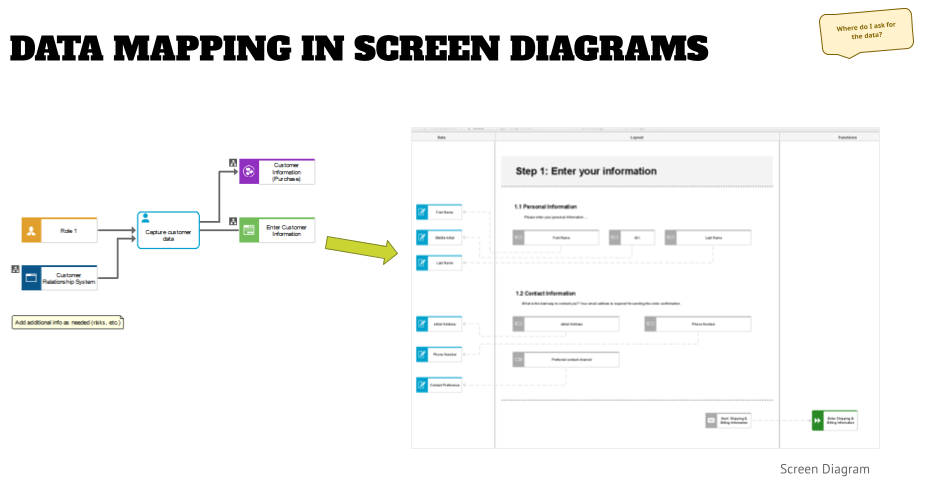
As you see in the graphic above there is also a screen object (the green object to the right of the task) modeled. Typically they are used in SAP implementations, where screen objects represent the ERP transactions.
But this is just one way to use screens – the better way to use them is to assign a screen design model to them and do a mockup with data mappings to them.

In the example above you see a three-column layout: a data column on the left, the screen elements in the middle, and a function column to the right.
The main purpose of this diagram type is to do a mock-up/low-fidelity design of the future application screen. Therefore a good architecture tool gives you objects that represent text fields, dropdowns, radio buttons, checkboxes, and so on, replacing the need for a wireframe tool like Balsamiq. It also allows you to structure the sections of the screen, as shown with “personal information” and “contact information” in the graphic.
On the bottom of the mockup you see a button object that could read “next” or “enter billing information”.
The next step now is to two things:
- On the left side you see the attributes from your logical data models being reused and mapped to the screen objects. This answers the question “where do I ask for this data?”.
- On the right side you see a function from the underlying process being mapped to the button, indicating the next step. This brings together the outside-in perspective of customer journeys and the inside-out perspective of the (internal) process that delivers what the customer wants.
But screens are just one way to answer the “where do I ask for data”, another example would be forms where you can do similar mappings in Document Structure models. However, I typically prefer to model the data in forms in a regular ERM diagram that is assigned to the cluster object (as shown in part 2).
Excursion – how to use screen objects elsewhere?
Using the screen objects as shown above is one way to do this. However, screens are one of the most underused objects besides these two use cases. It can be pretty powerful to use them to design the user flow in your new (web) application development, and is a perfect companion to the customer journey maps that you might have created elsewhere to capture the “outside-in” perspective.

The mock-up example shows a typical screen flow in an online shop – a user goes to the homepage and either finds what she is looking for directly as a suggestion, or will use the search functionality to get to a product page via a category page.
Once the product is added to the cart, the customer data example that we’ve used through this series kicks in and the steps for adding shipping info, billing info, payment info, and contact info are shown in the gray bar above.
One thing while creating this customer happy path was to notice that the information might have to be changed, so therefore four “change” screens were added. In addition to this the question of where to go after a product was bought came up, and screen navigation models are a good tool to have a discussion about where you want to steer the customer after an action has been accomplished.
This, in addition with the detailed screen design, will then also help identifying where to do changes in a future release when new information requirements need to be added to the application.
Summary
When modeling data as part of a project, the three questions that we looked at in this series come up all the time, and it might be enhanced by data privacy requirements. I have also seen that a lot of projects struggle with this, and don’t know where to start.
Unfortunately there is no reference content available that would have proper definitions that an industry would have agreed upon to my knowledge (please correct me if I am wrong). Therefore the three step approach that we discussed here, starting with a conceptual data discovery session -and don’t look at tools for that in the beginning- is the best starting point that you have.
Hopefully this series has acted as a guide for your data modeling needs. Let me know how your experiences are in the field!
Roland Woldt is a well-rounded executive with 25+ years of Business Transformation consulting and software development/system implementation experience, in addition to leadership positions within the German Armed Forces (11 years).
He has worked as Team Lead, Engagement/Program Manager, and Enterprise/Solution Architect for many projects. Within these projects, he was responsible for the full project life cycle, from shaping a solution and selling it, to setting up a methodological approach through design, implementation, and testing, up to the rollout of solutions.
In addition to this, Roland has managed consulting offerings during their lifecycle from the definition, delivery to update, and had revenue responsibility for them.
Roland is the VP of Global Consulting at iGrafx, and has worked as the Head of Software AG’s Global Process Mining CoE, as Director in KPMG’s Advisory, and had other leadership positions at Software AG/IDS Scheer and Accenture. Before that, he served as an active-duty and reserve officer in the German Armed Forces.