How to set up the Technical Governance – part 1: data models
Defining the Technical Governance as part of your implementation seems to be a quick exercise – why should you create data models and a meta model when configuring the method in your architecture tool? Isn’t that an effort that one can save and just run a report that spits out the details of the configuration when needed?
I disagree with this approach, and will show in this article series how creating these two types of models will help you identify what needs to go into the configuration, and also avoid multiple “add-on” releases of the configuration. A too frequent schedule of method changes (less than a year is too often for my taste) does increase a perceived uncertainty in the stability of the new application, and also increases the effort in training and communicating with users and stakeholders.
In addition to this you should design and document your thinking, so that your successors can review and understand what you thought when doing this work. The data models are stored in a “Solution Architecture” database in your architecture tool, and the meta model is created in a separate “Config” database. This gives you the opportunity to add future enhancement ideas in a “next state” model after the initial release/during the year that will be ready when discussing changes in the next release with your stakeholders.
This article looks at the first of the three major activities when configuring the tool: creating the data models, designing the meta model, and change the actual configuration (based on your tool choice this can be accelerated significantly when you have a meta model in your “Config” database).
Data models as the foundation for the implementation of the architecture tool, as well as interface design
One observation in projects is that clients like to skip over this phase, or do this in a non-graphical way, while showing a mysterious “data dictionary” in a long spreadsheet, that mostly scares away non-technical stakeholders and team members. There is a better way to do this, and having good looking and easy-to-understand data models is very helpful to bring everyone on the same page (literally).
The first step is to have a look at the objectives and which architectural views and artifacts need to be created. Then it needs to be determined which information needs to be captured and how this information is related to each other. Some of this is determined by laws and regulations, other areas are free to be determined by the program. For the latter group a good start is to look into the chosen tool’s method help. All professional architecture tools come with an underlying method that is documented.
The outcome of this is a list of items like “regulatory obligation”, “process”, “vendor”, or “application”, and most likely you already think ahead where this information is captured and how it is broken down. Stop this for a moment, and rather think of this as abstract items and determine how they are related to each other (and note down your thoughts which app is housing which info on a piece of paper for later). Capture these in business terms, and do not refer to them in the technical term that an existing might use (the mapping between the logical data model and the physical data model, how an application stores data in tables in fields, comes in a future solution design later).
For example: a process is done by roles that follow a series of tasks that are supported by applications and might have risks associated with it. Does that mean that all these things are properties of the “process” entity (a data modeler’s slang for a “thing”)? No – an application is different from a process and can be used in multiple processes, a role is an organizational element that can be aligned to positions which then roll-up to organizational units, and a step is part of the process on a lower level. Risks can be associated with many of these elements, such as application risks (“what happen if this app fails?”), operational risks (“what happens if this process or step is not executed correctly?”) or organizational risk (“how risky is doing a project with this vendor for my business?”).
This shows that it makes sense to distinguish between the “things” and the relations these things have to each other.
Create a high-level data model in your architecture tool
This brings us to the second step of this exercise – open up your modeling tool and create a high-level logical data diagram that shows the relationships between the entities. Do this in a new database (“Solution Database”) that you will later enhance with additional models outside of the data modeling activity, such as governance processes, or permission matrices.
The graphic below shows an example of a high-level data model.

When modeling the relationships think of the following patterns:
- Direction of the connection. Is it bidirectional or just one direction (an application impacts a process; does a process impact the application as well?)? Draw an arrow between the two entities.
- Does your entity stand alone or can it be decomposed to more detail on multiple levels (processes or org units typically are decomposed on multiple levels). Do not draw these multiple levels in the high-level data model, but rather depict this with a self-referencing arrow (see “Enterprise Hiearchy/Process” in the graphic above).
- Identify the relationship type between the entities. Is it just a single relationship between two entities, or a complex relationship between multiple objects (for example the “4-way relationship between Process, Obligation, Risk and Control in the graphic above). The rules for these complex relationships need to be understood and noted down.
In addition to this, you can also add the cardinality to the relationship – is it a 1:n or a n:n relationship. An example of a n:n relationship is the relationship between applications and processes; a process can be supported by multiple applications, while an application can support multiple processes. - Can you categorize the entities into “buckets”? In the graphic above all regulatory requirements are captured under “Regulatory Baseline” while processes, apps, etc. are captured under “Operations (Design)”. This categorization can determine your model layout and makes it easier to understand for non-technical stakeholders.
Make it easy for your readers to understand how you laid out the entities in the diagram – what is the story you want to tell?
Once you have created your high-level logical data model, plan a workshop with your stakeholders to verify and socialize your result, and get their formal approval. Getting the stakeholder buy-in to this high-level model is the most crucial step for the tool configuration and future development efforts. Be prepared that you still will get requests to add stuff once they fully understand what you will configure – the data model might be too abstract for some stakeholders and they won’t admit that at this point.
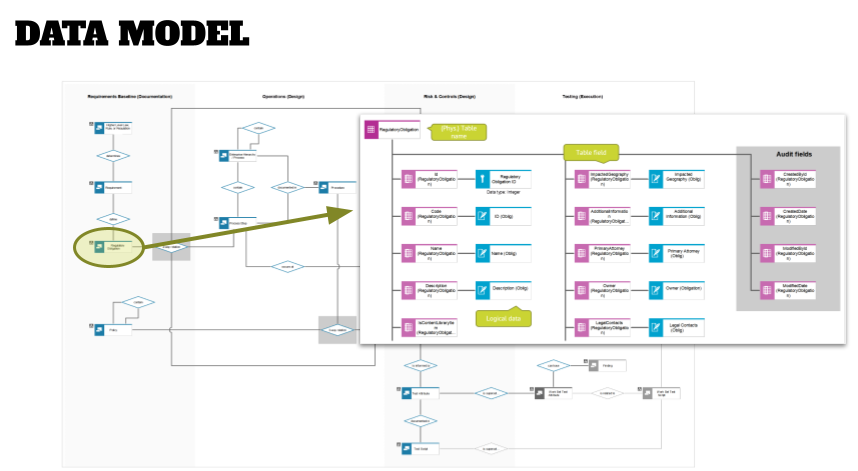
Add details to the entities to the next level of the data model
The next step is to create more details to each entity:
- How is this entity described? Typically, you find technical attributes, such as an ID that a system uses to uniquely identify a record of the entity, and business attributes, such as a description or frequencies (for events), or time attributes (for processes). Capture these in lower-level data models as shown below, and add attributes that make sense for you to these, and not necessarily technical field names that a system might provide; even though it might be a good start to go through the screens of your application and note down the attributes that are captured there. Just don’t stop here in your thinking – if a system does not provide that attribute, then you’ve identified a future enhancement requirement!
- When you intend to interface with other systems, you might want to have a look at the data model of that system and create a separate lower-level data model of that system. Most likely you will see that these systems capture way more information that you will need for your purposes. However, these external data models will be reused when it comes to the interface design – see below.
- Also look at the format of the attributes: is it a regular text field that is needed (and how many characters?), or a number or date field? What is the format of these? Add this to your attribute object information, and your solution architect/developer will thank you later when this attribute needs to be customized in the application.
- A last step here is to identify the key and foreign key attributes. What is the unique attribute of your entity that identifies the entity? Are unique IDs of other entities referenced in your entity and therefore need to be identified as foreign key? In the graphic below you see the majority of attributes shown as normal (descriptive) attributes, while “Item Type” is a key attribute for the process entity, and “ARIS GUID” is a foreign key.

Once this step has been accomplished, socialize the lower-level models with your stakeholders again and capture their feedback. In this round of review the technical stakeholders, e.g. owners of other applications, have a more prominent role, and most likely want to run these models by their solution architects before providing feedback.
Define the data requirements for technical interfaces
The attributes of the lower-level data models will be used for future mappings in the interface design phase, as well as the identification of tables and fields (physical data modeling) in the future. The graphic below shows an example of an interface mapping.
You might have to create additional interface models, which might include the mapping of entities to model types. For example, when you have incoming interfaces from other systems of truth (“in which model type will these objects show up?”).
In addition to this you might also want to create technical application collaboration diagrams showing how the interface is set up and which data flows from one system to another. If you have multiple interfaces from one system to another, for example, when you have a data lake that you pull various information from, you also might want to create separate diagrams showing which information will be included in which interface (more details on this will be discussed in a future “technical interfaces” article).

For documentation and future reference purposes, I recommend to start a “Solution Architecture Overview” presentation that can create links to the data models and future additional models, and update this with each major release. Stakeholders can use this deck later when it comes to detailed workshops or other decision points in the future.
Next step: create a meta model
By now you should have gotten your arms around what shall be captured and shown in your architecture tool. In part 2 of this series, we will have a look how to create a meta model, and in the last part of this series, we will look at the steps to configure the method in an architecture tool.
Roland Woldt is a well-rounded executive with 25+ years of Business Transformation consulting and software development/system implementation experience, in addition to leadership positions within the German Armed Forces (11 years).
He has worked as Team Lead, Engagement/Program Manager, and Enterprise/Solution Architect for many projects. Within these projects, he was responsible for the full project life cycle, from shaping a solution and selling it, to setting up a methodological approach through design, implementation, and testing, up to the rollout of solutions.
In addition to this, Roland has managed consulting offerings during their lifecycle from the definition, delivery to update, and had revenue responsibility for them.
Roland is the VP of Global Consulting at iGrafx, and has worked as the Head of Software AG’s Global Process Mining CoE, as Director in KPMG’s Advisory, and had other leadership positions at Software AG/IDS Scheer and Accenture. Before that, he served as an active-duty and reserve officer in the German Armed Forces.